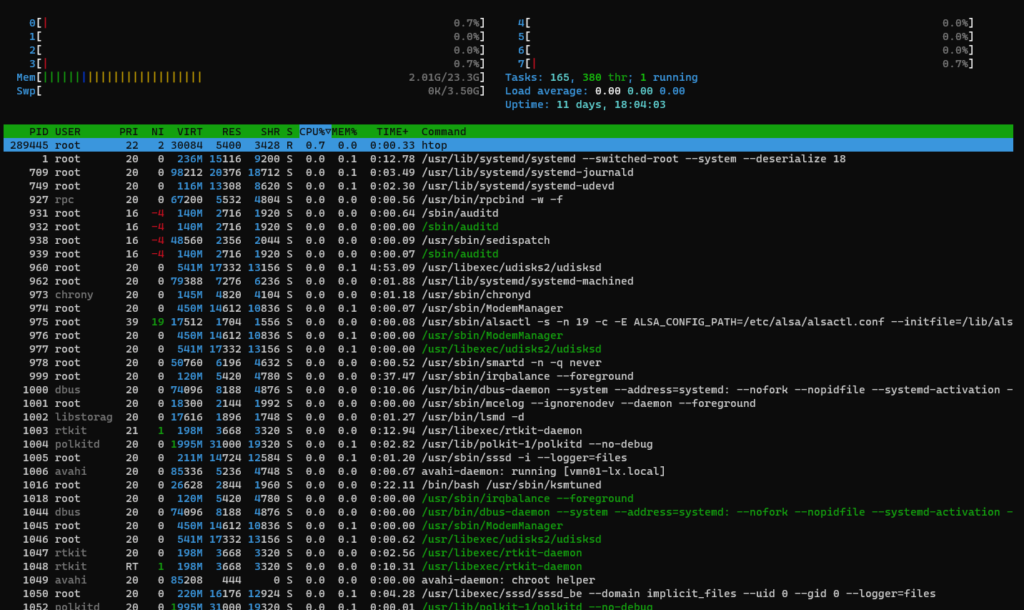
htop is a lightweight to available for Linux systems to show a dynamic overview of the running processes and the system resources used. Compared to the classic top this process manager offers some convenient functions. Here we see the steps to install it on AlmaLinux, CentOS, 8, Rocky, Oracle, or RHEL.
The program has a ncurses interface, ncurses stands for new curses, it is a free C – program library to a character-based user interface (Text user interface – TUI) independently of the illustrative text terminal or terminal emulator display. Htop can easily be operated with the keyboard without having to type long commands. If htop is started in a terminal within a desktop environment, the mouse can also be used. If you want to use the mouse in a virtual terminal, gpm must be installed.
In addition, the program offers a freely configurable bar in the upper part of the display. Their graphs for the system resources and various other information can be output.
As per the developer in htop, unlike comparable process managers, all individual threads of a process are displayed. This is easy to see in the tree view. However, the total memory consumption of the parent process is specified for each thread and not just for the respective thread. In “Setup” with F2, the listing of all threads can be completely deactivated or configured so that they are grouped in color.
1. Run system update
Let’s first update all the system installed packages along with the refreshing of system repositories.
sudo dnf update
2. Add Epel Repository
The packages to install htop on AlmaLinux, CentOS, RHEL or Rocky Linux are available in the EPEL repository, thus first we have enabled it on our system if you have not already.Copy Me
sudo dnf install epel-release
2. Command to install htop in AlmaLinux or Rocky
So, as what we need to htop has been set up, now its time to install it using the below-given command-Copy Me
sudo dnf install htop
3. Run htop on Almalinux/Rocky/CentOS/RHEL 8
Once the installation is completed, we can run it on our terminal to start monitoring various processes. At the top of this tool’s interface, you will also get a quick view of system hardware consumption by your Linux operating system.
htop

4. Use htop options or parameters
With the htop command, we can use several options to get customized results or change settings. Such as to delay update rate, we can use -d parameter.Copy Me
htop -d 10
10 is the time in seconds.
| parameter | function |
-d--delay= 10 | Specify the update rate in 1/10 seconds |
-C--no-color--no-colour | Start without colors |
-h--help | Show quick help |
-u--user=username | Show only processes of the specified user |
-s--sort-key | Sort by a specific column. A list of the permitted column names can be htop -s help output with ” “. |
-v--version | Show version |
htop Keyboard shortcuts

We can use the mouse to select and use the options given at the bottom of htop along with others, however, to access things fast and efficiently, the keyboard shortcuts will be best to use with htop. Here are some key shortcuts to use.
| Keys | function |
| ← , ↑ , → , ↓ | Scroll through the process list |
| ⇧ + U | Remove all tags |
| . or , | Incremental search for the PID |
| F1 , ? , H | to show help |
| U | Show processes of a user |
| F2 , ⇧ + S | Open setup and change settings |
| ⇧ + H | Show/hide user threads |
| F3, ⇧ + / | Incremental process name search |
| ⇧ + K | Show/hide kernel threads |
| F4, \ | Filter by name |
| ⇧ + F. | Pin the cursor to a process |
| F5 , T | Activate / deactivate tree view |
| + , – | Expand/collapse the tree |
| F6, > | Select column to sort |
| ⇧ + P | Sort processes by CPU usage |
| F7 | Decrease Nice value |
| ⇧ + M | Sort processes by memory usage |
| F8 | Increase Nice value |
| ⇧ + T | Sort processes by the time |
| F9, K | End the process or processes of a day |
| L | Open files with lsof open |
| F10 , Q , Ctrl + C | break up |
| S | System calls to stracetrace |
| Space bar | Tag process |
| ⇧ + L | Track library ltracecalls |
| I | I / O control |
Credits: Linux Shout
